Understanding Percent of Percent-Load Reports
- Document Type: KB
- Released: 2025-11-10
Contents
Percent of Percent-Load Reports provide valuable insight into potential hardware bottlenecks and are an excellent tool for capacity planning.
The only challenge is that they can be a TINY bit non-intuitive - until you understand what they're expressing.
Percent-Load is Easy
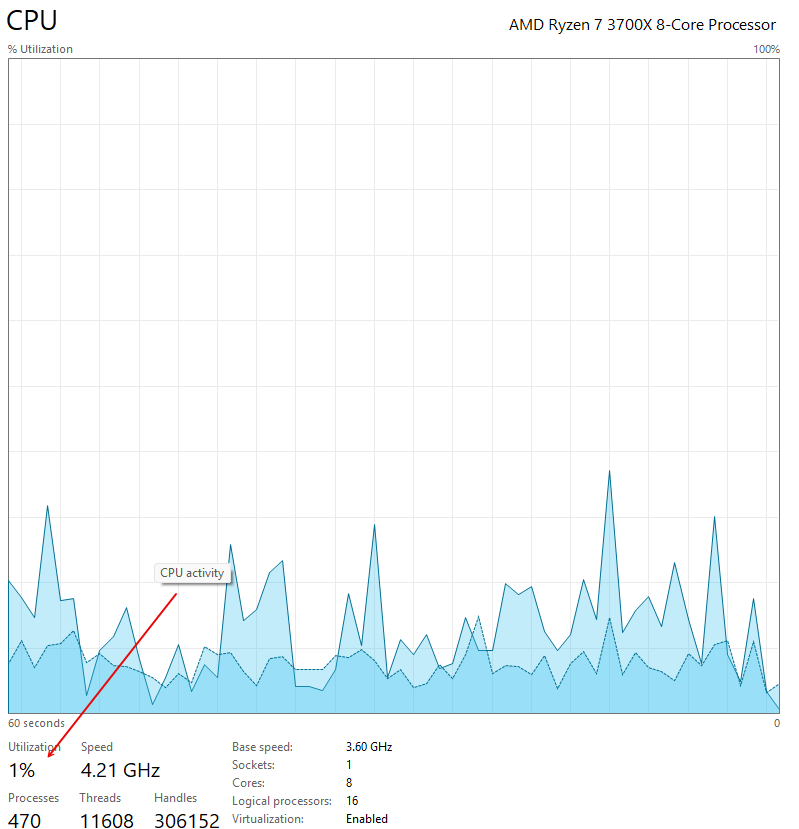
To wrap your mind around percent of percent-load reports, think of how intuitive a simple "Percent Load" report is - like CPU usage graphs.
For example, if you crack open Task Manager on a Windows machine right now, you'll see a measure from Windows of just how much of your total compute capacity is in use - right this second:
Percent of Percent-Load is Just Percent-Load - Over Time
Now, imagine watching CPU usage via this same graph over a period of 10 seconds - where you're scribbling down CPU usage at the top of every second on to a notepad.
- Assume that for 7 of those seconds (i.e., 70% of the overall time in question), CPU usage was below 20% utilization.
- And assume that CPU was up in the 20-30% range for 2 of those 10 seconds - i.e., 20% of the overall observed time.
- Likewise, assume that CPU usage 'spiked' up into the 60-80% usage range for one of those 10 seconds - or 10% of the overall time.
Now assume that you converted what you had observed into a report - with a breakdown of WHAT PERCENTAGE of TIME (across that period of 10 seconds) was spent in each CPU usage 'bucket' or utilization 'rate'/range.
Doing so would give you a percent (over-time) of percent-load of your CPU, similar to the following:
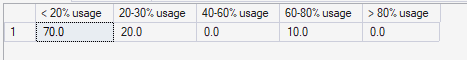
And that's really it. Percent of Percent-Load reports simply show what percent of the overall monitored time was spent in which 'percent-load' categories or 'buckets'.
The Real Benefit of Percent of Percent Load Reports
The real power of percent of percent-load reports is that they can easily capture days or weeks of real-world workload capture - which can then be distilled into a single, simple, report that provides significant insight into hardware utilization trends and patterns.
Stated differently: by automating the capture of key indicators - every second - for days or weeks at a time, we can:
- capture workloads at all times of the day - and at various points during the week (e.g., some workloads get hammered on Mondays as users get back in office and are requesting reports, logging in to various apps, and/or pulling down workloads, etc.). By capturing metrics and reporting on operations for periods of over a week, it's possible to gather a solid 'snapshot' of overall server usage trends and scenarios.
- capture valuable workload metrics that can be very helpful in identifying bottlenecks as well as help showcase where some servers are simply over-provisioned for what their workloads actually, truly, require. (This one can be huge when evaluating how many CPUs need to be licensed for your SQL Server workloads.)
Digging Deeper: Report Types
Percent of Percent-Load Reports focus on three main (core) areas: CPU, IO, and Memory.
CPU Reports - Current vs Estimated Core Counts
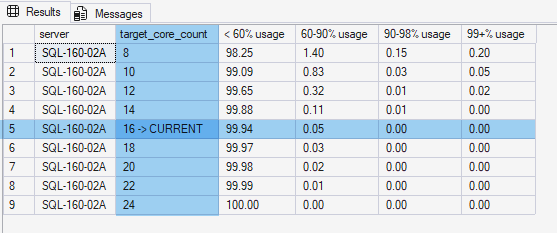
Because long-term CPU usage is such a critical metric in determining licensing costs, CPU Percent of Percent-Load Reports commonly include an additional column - the [target_core_count] column - which, in turn, 'complicates' these reports a tiny bit, as per the image below:
Specifically:
- Note
Row #5- which shows the 'current' (or actual) number of cores in place onSQL-160-02Aduring the 2+ weeks that the server was monitored. - This row,
#5, is showing us the actual CPU Percent of Percent-Load - and shows that we spent 99.94% of the total time monitored at 60% CPU utilization - or lower. - Likewise, during the 2+ weeks monitored, we also spent .05% of the total time with CPU usage between the 60-90% usage rate.
Subsequently:
Row #4- for example - shows us an APPROXIMATION of roughly what kind of breakdown we WOULD have expected HAD there only been 14 cores onSQL-160-02A- instead of 16.- Likewise,
Row #3takes this APPROXIMATION down to roughly what we could have expected with just 12 cores, and so on.
Caution:
Processor utilization is NOT discreet enough to allow the [target_core_count] values in CPU Percent of Percent-Load Reports literally. (Queueing, Hyper-Threading, and a host of other things make it so that any target core counts defined in these reports are ONLY useful as a rough approximation.)
With the caveat that the metrics for higher or lower core-counts projected by the [target_core_count] column can NOT be taken literally, it is possible to get both a rough idea of possible options for decreasing core-counts (and saving licensing costs) as well as potentially focusing tuning and optimization tasks.
For example, for the 2+ weeks that SQL-160-02A was profiled, it was over-provisioned in terms of CPU.
- This might be just fine/perfect - because MAYBE we're planning on seeing increased workloads for
SQL-160-02Aat a couple of peak periods during the year and/or just expecting overall growth.- Likewise, maybe the workload on this server is critical enough that some 'extra padding' in terms of CPU is warranted.
- It's also possible that this server just ISN'T that important and we'd rather look at 'trimming' Licensed core counts - at which point, depending upon how 'white knuckle' we're willing to run this box, we could conceivably cut down core-counts on this box by 2, 4, 6, or EVEN 8 cores - based on the numbers in question. (Again: Warning here over HT cores - they'll throw these metrics off in a hurry if/when they're in play.)
- And, in terms of tuning, maybe the goal here is to trim as many SQL Server Licenses as possible - at which point, some focused tuning on whatever is being run when CPUs on
SQL-160-02Ais under 'peak' load is something worth looking into - because IF we could tame that (or be fine/comfortable with the CPUs being hammered while under peak load - i.e., maybe this is nothing more than aggressive backups or an aggressive maintenance window vs end-users waiting on the CPUs being hammered), then running this box on 8 cores would be more than feasible under the current workload needs. (💡 Saving 8x cores amounts to roughly $8K/year for Standard Edition and over $30K/year for Enterprise Edition licenses.)
- And, in terms of tuning, maybe the goal here is to trim as many SQL Server Licenses as possible - at which point, some focused tuning on whatever is being run when CPUs on
Either way - the benefit of Percent of Percent-Load reports is that they provide emperical insight that allows you to match your business needs and goals with what's actually happening with your workloads.
IO Subsystem Reports - IOPs, Throughput, and Stalls (Latency)
Because IO usage isn't as straight-forward as CPU usage (i.e., a simple % of available compute or CPU capacity), IO Percent of Percent-Load Reports focus three main performance areas:
- IOPs. IOPs provide a rough sense for just how many IO operations can be executed in a given second (hence the name). In broadest terms, think of these as the total number of vehicles that can occupy a 1-mile stretch of 8 lane highway in a given second; the higher the number, the more people you're probably able to move.
- Throughput. While IOPs help tell the story of how MANY people you might be able to 'zip up and down' a metaphorical 8-lane highway in a given second, Throughput is better thought of as a measurement of the amount of CARGO (or weight) a given highway can sustain at any given time. For example, a given highway might have insanely high IOPs - but only because there are bazillions of one-person scooters crowded into all 8 lanes of a 1-mile stretch of highway. That's great in terms of raw numbers - but you could potentially get MUCH better density IF you were able to chock your stretch of highway full of triple-decker buses - loaded full of humans - especially if those buses were able to avoid the kinds of gridlock you MIGHT encounter with a bazillion vespas. Or, in other words, SQL Server workloads can, do, and will need BOTH high-throughput (for larger reports/data-operations, backups, restores, and the likes) as well as high IOPs (for quick writes to the T-LOG and so on). Tracking both is the key to getting an overall sense of how your workloads are performing during all load conditions.
- Latency. Regardless of whether we need IOPs and/or Throughput for our workloads, the best way to tell if our IO subsystem is falling behind is to check for situations when IO latency (the number of milliseconds it takes for the IO subsystem to respond to requests for reads/writes) is above expected levels. Specifically, even the best-tuned and most optimized IO subsystems will occasionally get hit hard enough to incur stalls (latency) on order of 1-2ms here and there. But, any time we're seeing sustained stalls above just a handful of milliseconds is an indicator that we're stating to see degradation of the IO subsystem. (e.g., assume that we were seeing IO latencies of 2ms - 100% of the time; this would indicate a 'death by a thousand cuts' kind of scenario where virtually all operations executed by SQL Server taking a tiny 'hit' to performance all the time.)
Otherwise, with the 3x vertices being monitored mentioned above, IO Percent of Percent-Load reports typically come in two discreet reports.
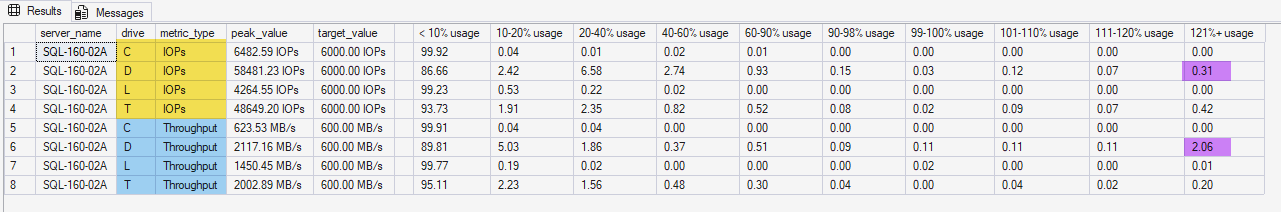
The first, covering both IOPs and Throughput - as shown below - is broken out into two parts, one showing IOPs, and the other showing Throughput:
Some important considerations with IOPs and Throughput Percent of Percent-Load Reports:
- Percent-Load details are reported PER disk - i.e., in the image above, throughput on the
C:\drive is substantially less than that seen on/by theD:\andT:\drives. - Peak values for both IOPs and Throughput are recorded - i.e., these are the MAX amounts recorded during the time that the system in question was being profiled.
- In many - but not all, IOPs and Throughput reports, a
[target_value]column is specified - which define 'ideal' minimum thresholds for both IOPs and Throughput based upon overall workload types and expectations (e.g., 4000-8000IOPs are common targets for many high-usage OLTP and/or heavily-used reporting servers, with throughput ranging from 200MB/sec - 900MB/sec being common targets based on DB sizes and backup/restore expectations, etc.)- In SOME cases, these values are relatively arbitrary.
- However, in some other cases - e.g., EC2-hosted SQL Server instances, or in scenarios where we KNOW the published maximums for expected IOPs and Throughput, the
[target_value]s specified might be provided by vendors or through SLAs, etc.
- In cases with with specified
[target_value]s, it IS possible to exceed these targets for a number of reasons. (For example, with AWS hosted instances, EBS volumes can, do, and will routinely EXCEED published and paid-for SLAs for as much as 1-2 seconds in many cases before AWS throttling "kicks in" and returns IOPs/Througput back to purchased/agreed-upon levels.)- By way of example, the 2x cells highlighted in the image above show that - for example on
Line #6, Throughput on the D:\ Drive was specified at NEEDING to be at least 600MB/sec - which was exceeded 2.06% of the 2+ weeks profiled for the server in question (i.e., we consistently saw throughput HIGHER than 600MB/sec.)
- By way of example, the 2x cells highlighted in the image above show that - for example on
Latency, on the other hand, is broken down into 4x distinct categories of stall/latency 'ranges': green (good to great - i.e., NO problems), yellow (not ideal but not problematic either), red (trending into latency impacting users/apps), and 'swamped' or scenarios where we're seeing 60ms+ latency - indicating that the IO subystem is being hit so hard that it just can't keep up:
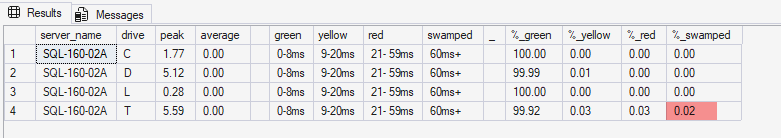
So, for example, in the report above:
- IO Latency for disks C, D, and L were all solid/excellent over the 2+ weeks profiled - i.e., with Disks C and L spending 100% of the time in the 'green' (0-8ms) latency range, and with only .01% of the time in question in 9-20ms latency seen on/against the D drive.
- On the other hand, while the T drive was overwhelmingly within good/great margins (20ms or lower usage), there were a few points where latency was trending ugly (.03% of the time in 21-59ms latency) and a sliver of time (.02%) spent with the IO subsystem simply being overloaded.
💡 Tip:
Importantly, 'troubleshooting' exactly what's going on with the IO subsystem can be non-trivial. For example, it's possible that NOTHING is 'wrong' with our SQL Server workload during the .03% and .02% of the time seen in 'red' and 'swamped' thresholds in the image above. Specifically, this COULD merely mean that SQL Server is PUSHING the IO subsystem "to the limit" while creating larger (e.g., FULL or DIFF) backups; or this COULD be something entirely unrelated to SQL Server - MAYBE we were trying to push backups (or write transactions - it just depends on what this disk is used for) while antivirus scans are running against the FILE SYSTEMS of a huge number of VMs pointed at the SAN being used for underlying storage. Likewise, JUST BECAUSE we see a couple of indications here of potential problems, this doesn't (typically) mean that we need to throw a few $Million at a brand new SAN. Instead, tuning/optimization here can be a simple question of 'missing' indexes, code optimization, or possibly just 'juggling' schedules better, or even just KNOWING what's going on at the times in question and being 'fine' with laggy-ish performance during those brief windows.
Memory Subsystem Reports - PLEs, Grants, and Workspace GBs
The Memory Subsystem is a critical component to ensuring the proper care and feeding of SQL Server workloads. Accordingly, Memory Subsystem Percent of Percent-Load reports focus on 4x main indicators of overall memory usage and health:
- PLEs. In overly-simplistic terms, PLEs are a ROUGH measure of approximately how MANY SECONDS SQL Server 'thinks' it can keep an 8KB block of data in memory before said block of memory will be 'pushed out' due to memory contention (by other pages (or operations)). For most modern workloads, PLEs on order of 5,000-7,000 (seconds) or above - on a consistent basis - are usually a pretty solid indication that you have enough RAM and aren't hammering your IO subsystem to keep up.
Arguably, during some operations - including RESTORE tests, backups, and DBCC operations, PLEs can and will drop down to lower levels. If these periods are 'off peak hours', then PLEs between 1,200-5,000 can be 'fine'. Otherwise, any time you see values less than 1,200, you can and should expect that - with MOST workloads (but not all) - you're seeing significant memory pressure and/or hitting your disks a bit too hard and/or you might have some excessive grants 'stealing' RAM from the buffer cache. - Workspace Grants. Each time SQL Server needs to run a query/operation the engine has to allocate a 'working set' of memory (i.e., block of RAM) for said query to use during execution. And while the vast majority of queries/operations on most systems clip by without using any appreciable amount of RAM, there are cases where larger reports and some ugly code can and will use EXCESSIVE amounts of RAM (10s of GBs isn't uncommon) - which can be deleterious to overall performance. Consequently, Memory Percent of Percent-Load reports identify time-periods where large and/or excessive amounts of RAM are in use by queries via the
WORKSPACE_GBdimension. - Active Grants (Count). Similar to Workspace (GB) Grants, Active grants are simply a COUNT of the total number of GRANTS in play at any given time. For systems doing heavy amounts of reporting, higher numbers aren't necessarily an indicator of problems (problems really only come with low PLEs and/or High GRANT GBs in use), but can be an indication of pressure and/or indicators about the overall nature of a given workload/server.
- Pending Grants (Count). As the name indicates, this dimension tracks the overall percentage of monitored seconds that queries/operations were WAITING on SQL Server to free up RAM to provide a GRANT to allow a query/operation to go ahead and actually execute. Because waiting on a GRANT is a full-on blocker, any value > 1 here is an indicator of memory pressure issues due to the SIZE of reports and/or larger operations being run concurrently (and is usually an indicator of the need to tune some code and/or throw more RAM at your workload).
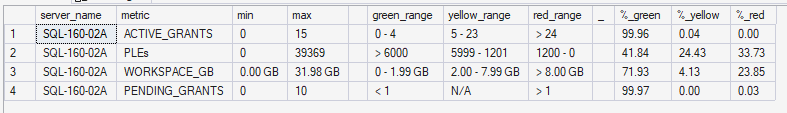
Given the nature of how each of the four memory dimensions tracked are measured in different units or ranges, Memory Percent of Percent-Load reports are broken up, horizontally, into roughly 3 main areas:
- Left-most are the server-name and metrics (dimensions) in question - along with observed MIN() and MAX() values recorded during the time the server was observed.
- Then, in the center of the report are definitions for thresholds - e.g., in the screenshot above, we're defining that
WORKSPACE_GBs(i.e., the total amount of RAM used by active memory-grants during in-flight execution) should have a green (good/fine) top-end of 2GB, a 'trending ugly' (yellow) threshold of between 2GB and 8GB, and that any time we're seeing > 8GB of RAM we're treating those scenarios, for this server, as red (ugly).- By way of context,
SQL-160-02Ahad 128GB of RAM when profiled - and is/was being used for both OLTP, DSS, and light-to-medium reporting. A server used for HEAVY reporting with, say, 512GB or 1024GB of RAM might set green, yellow, red thresholds as 20GB, 20-100GB, and anything > 100GB as its thresholds - by comparison.
- By way of context,
- Finally, on the right-side of the report, we see our actual breakdowns - or what percent of the time we spent (during the 2+ weeks in question) within green, yellow, and red thresholds. So, for example, with
SQL-160-02A, we can see too much time spent in yellow and red thresholds (> 50% of the time overall - within these realms) for PLEs - meaning that we need to either throw more RAM at this workload and/or look at tuning some of our larger memory hogs. Likewise, forRow #3, Workspace Grants, we can see that we spent nearly 24% of the total time this server was monitored with 8GB or more of our 128GB of RAM being consumed by active/running Query Grants. As such, we should look into what those reports (presumably) are doing and whether it's possible to easily tune or optimize them. If so, we might be more than fine with 128GB of RAM on box. Otherwise, we might want to look at throwing more RAM atSQL-160-02Ato help it keep things moving through quickly.- Likewise, and much more importantly,
Row #4- PENDING_GRANTs - shows serious problems/issues - in the sense that a) we actually hit points where SQL Server simply could NOT break off a block of RAM for 1 or more operations to run (as many as 10 at one point - i.e., see the 'MAX' colum for this row), meaning that we're seeing scenarios where operations are ACTIVELY stalled and waiting for more RAM. For most workloads, any waits here are pretty rare - so the fact that we're seeing bottlenecks (and a decent number of them too) is a strong indicator that we need to make this server a priority.
- Likewise, and much more importantly,